Construction Industry Webinar: From Code to Compliance – Mastering the Building Safety Act 2022
Join us for our upcoming live webinar – “From Code to Compliance: Mastering the Building Safety Act 2022” 🗓️ Date:
Read articleIn 2020 we have seen a monumental shift in data analytics from bottlenecked processes to data democracy. Analytics solution providers are increasingly providing features that enable everyone in your organisation to achieve data literacy – the ability to find answers from data without needing help from your BI or IT team.
Qlik is one of the forerunners of this movement, and their September 2020 release is testament to that.
Let’s take a look at the new features in the September 2020 Qlik Sense update.
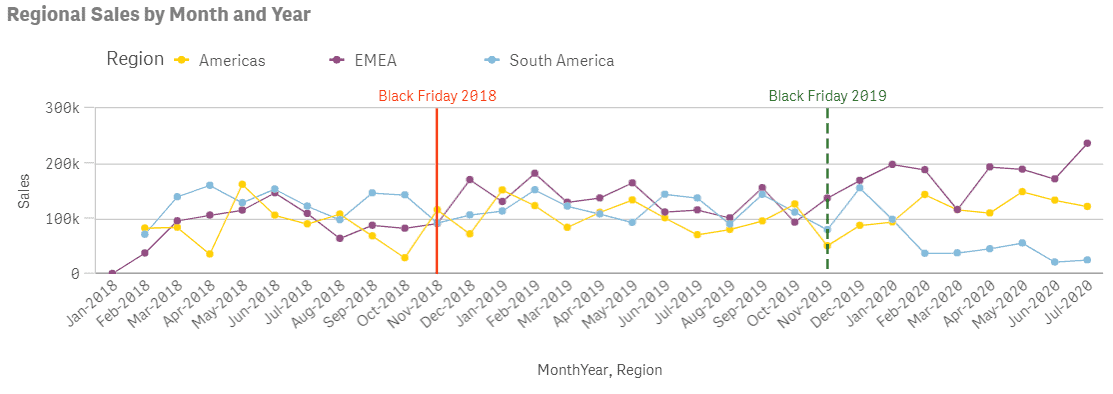
Vertical (dimension based) reference lines are now possible. This is a great new feature for adding reference points, e.g. if you need to highlight certain dates on a time chart.
For instance, customers who have dashboards monitoring performance impact of COVID-19 could now add a reference line for the date lockdown began.
The animator control, originally from the Qlik GeoAnalytics product, has now been built into the visualisations bundle in the base product.
This allows you to cycle through selections. You could, for instance, cycle down a list of customers, or see how data changes over time.
Watch the video I have created below for a quick tour of the feature.
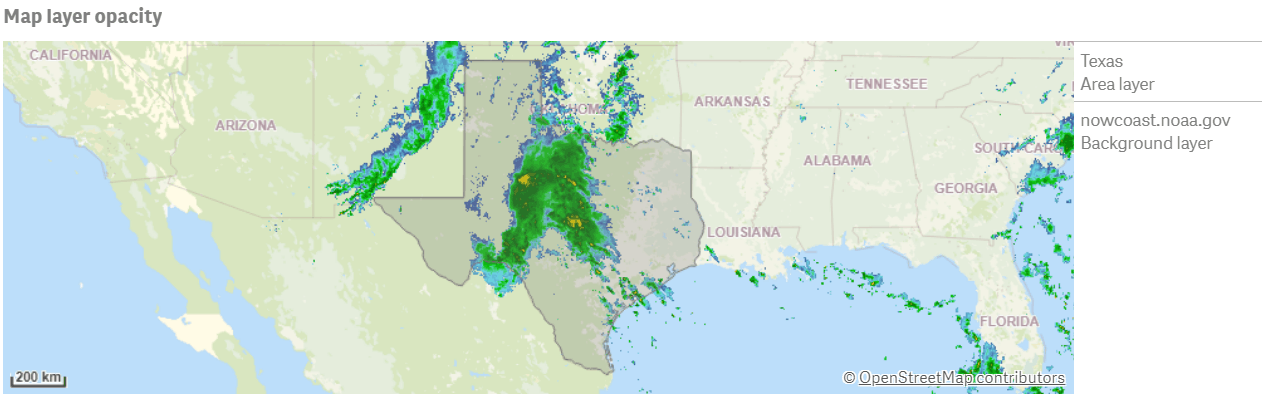
You can now control layer opacity on map visualisations – this allows you to have multiple layers that complement each other, rather than potentially blocking each other out.
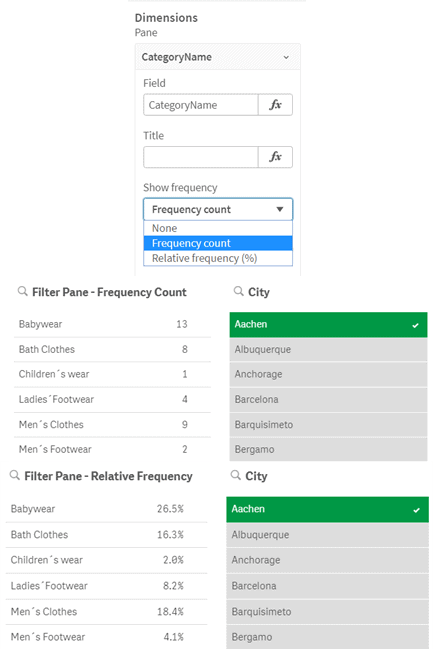
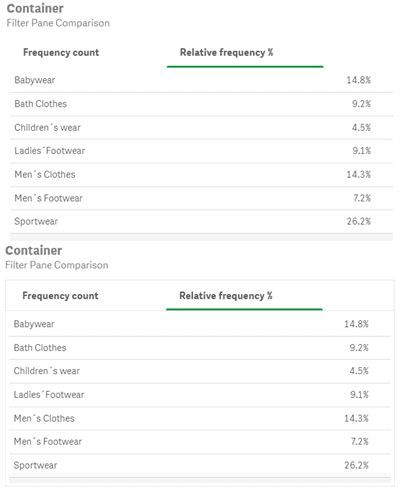
Filter panes can now dynamically show the number of times, or relative frequency, that the values in the pane appear in your dataset. This information is reactive to any other filters you apply to the dataset.
Get an at-a-glance view of whether certain values in a field are commonly in use or potentially low-frequency errors.
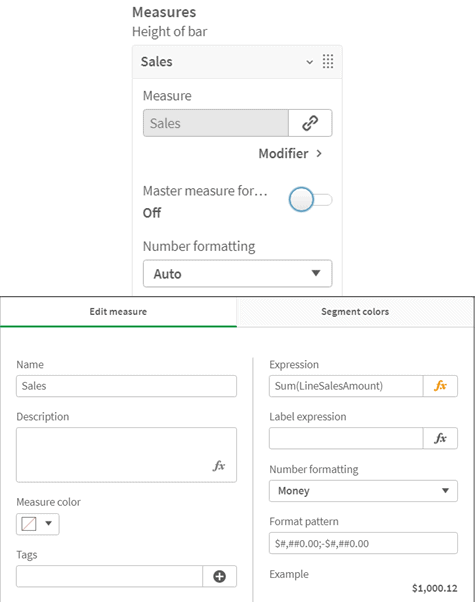
It is now possible to set a default numeric format for your master measures, with the added flexibility of choosing to apply a different custom format in the chart if required.
This is beneficial because if you need a very specific format (for instance a particular monetary format, or a specific number of decimal points) you only need to type out the formatting formulation once and reuse it. It also assists with consistency across the app.
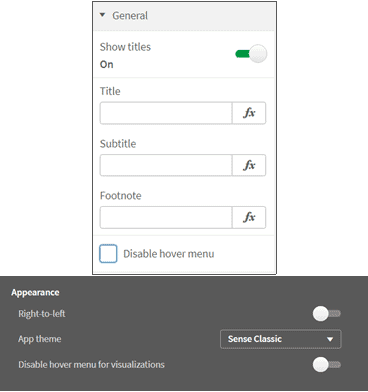
You can now choose to disable hover icons for individual charts or across an entire app for occasions where you feel they are not adding to the user experience.
You can now choose whether to enable borders on container objects.
It’s a purely visual improvement for User Interface (UI) purposes, but there is a big gap between QlikView and Qlik Sense in terms of controlling how things look, so it’s one more step towards closing that gap. It’s my hope that this improvement will soon be extended to beyond just container objects.
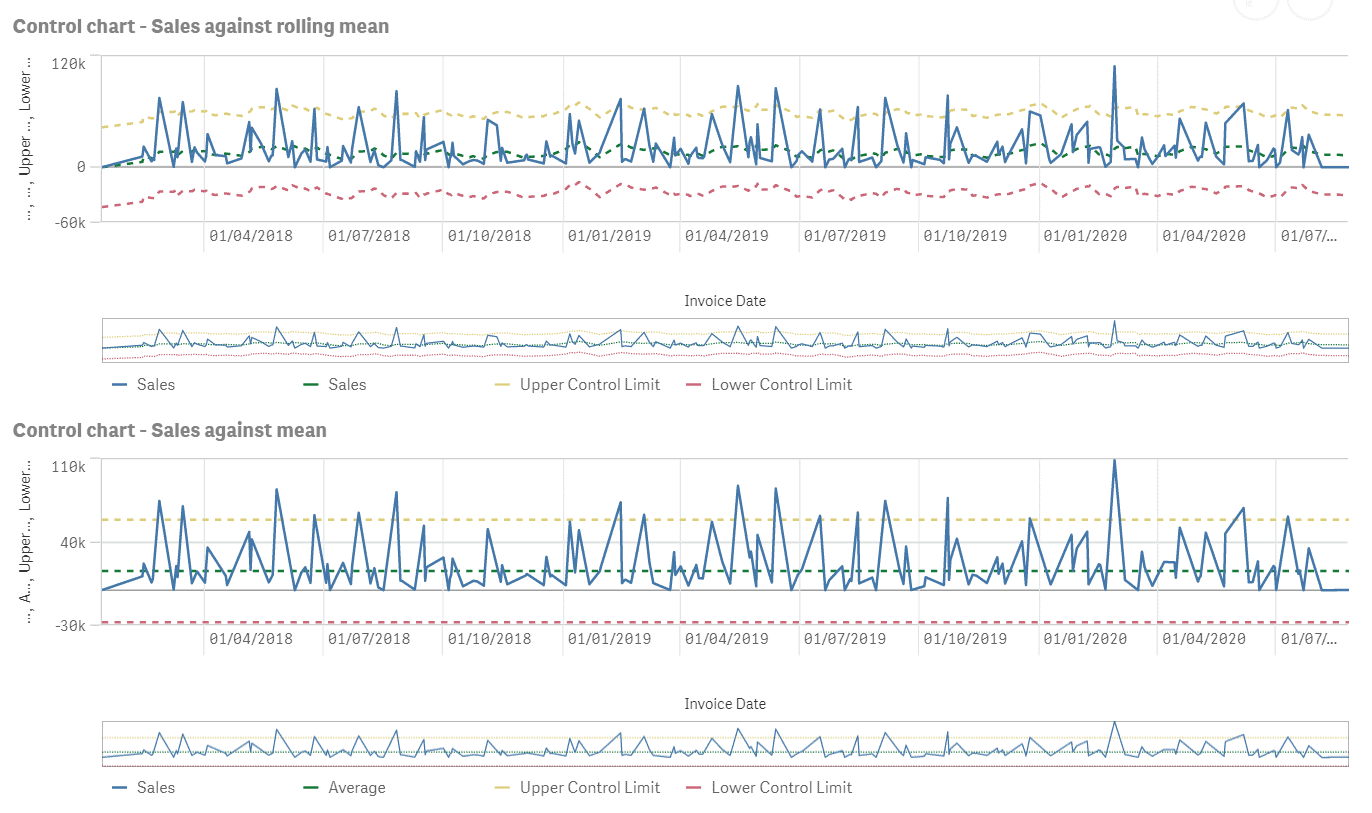
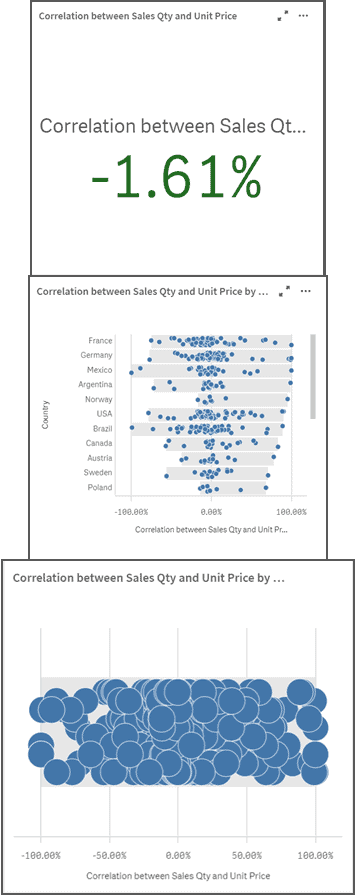
Some new charts have been added to the insight advisor; process control charts, correlation charts and cluster charts are now available in the full September 2020 release.
Some additional features that I think are worthy of a mention include the following:
With every new release, Qlik are taking huge strides to promote data literacy and data democracy within businesses. Enable all staff within your business to understand data, find the answers they need – without requiring help from your IT or BI teams. Remove bottlenecks and empower every employee within your organisation to do more with your data.
If you’re currently using Qlik Sense, we can help you to upgrade. In fact, our FlexCare for Qlik Managed Services packages can cover everything from upgrades and installations, to:
To discuss your Qlik needs in more detail, fill in our short form to request a fast, free call back from one of our friendly experts.
We understand there are many options to choose from and you want to make sure the tool you adopt is the right one for you.
"*" indicates required fields
Construction in Crisis! Written by Chrissie McAnelly, Cybit Data & Analytics Consultant – Construction Sector The construction sector is
Read articleBy Asiel Esgair – Cybit Data & Analytics Consultant – Public Sector & Local Authority In our
Read article